
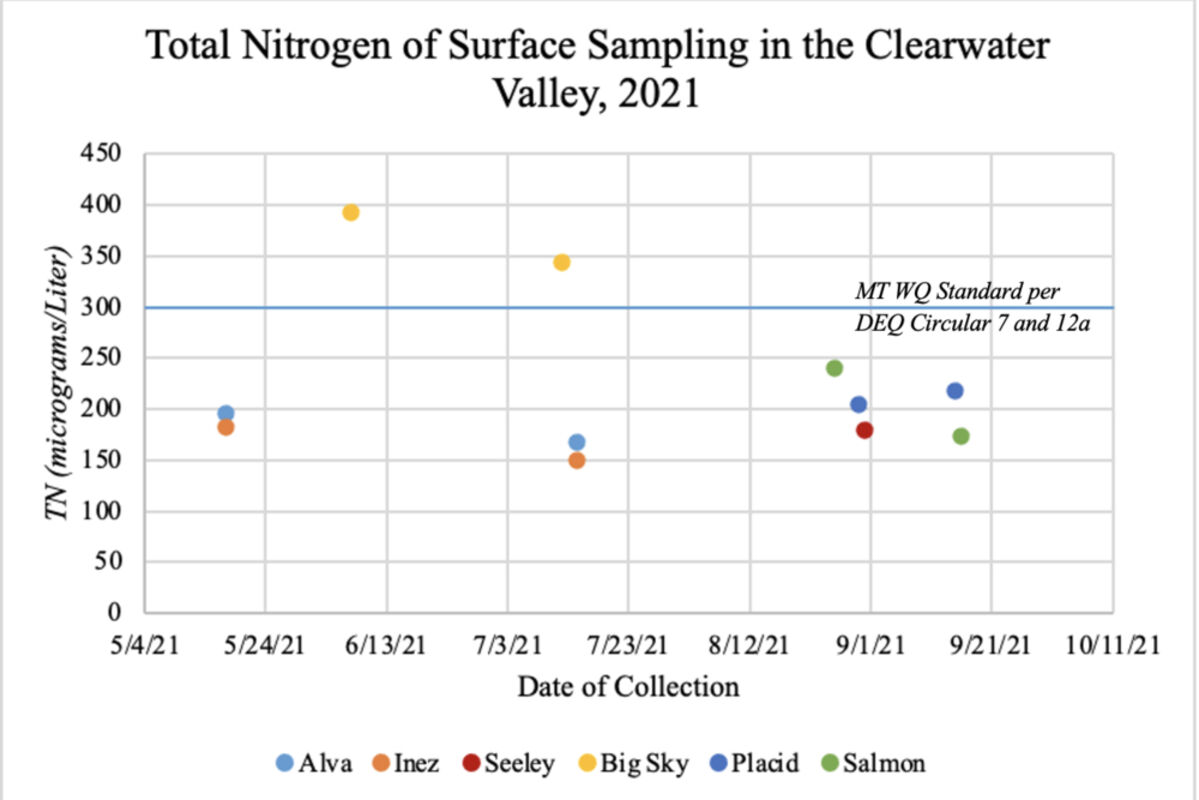
Figure 1: The Total Nitrogen of various surface samples taken across the six lakes in the Clearwater during the 2021 samplings season.
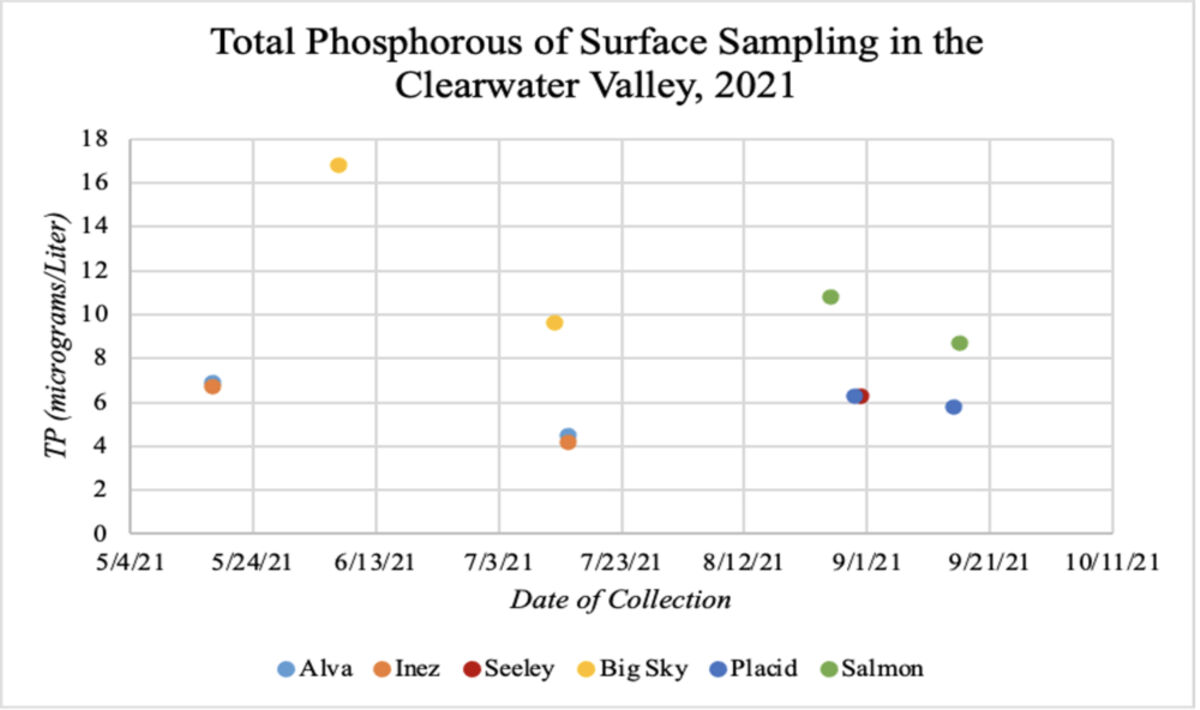
Figure 2: The Total Phosphorus of various surface samples taken across the six lakes in the Clearwater during the 2021 sampling season.
Lakes are highly interconnected systems impacted by multiple environmental conditions and anthropogenic pressures.
The Clearwater Resource Council (CRC) is committed to evaluating the health of our lakes in the Clearwater Valley by sampling lake waters and monitoring water quality.
As we learn more about the health of the lakes, we want to share the results of lake monitoring with you. Beginning in 2021, CRC began monitoring nutrients as a metric of water quality in six lakes in the Clearwater valley.
In 2021, Lake Alva, Lake Inez, Big Sky Lake, Seeley Lake, Placid Lake, and Salmon Lake were all sampled for concentrations of total nitrogen (TN) and total phosphorus (TP).
These nutrients can enhance the quality of our lakes but if there is too much nitrogen or phosphorus, human health and aquatic ecology can be negatively impacted through a process called eutrophication. Eutrophication is the process by which a body of water is progressively enriched with an excess of nutrients, particularly nitrogen and phosphorus, potentially leading to algal blooms as well as other associated issues.
As levels of TN and TP increase, particularly in ratios that allow for their uptake by plants or algae, a lake becomes more eutrophic and will exhibit greater production of plants (like lilies) and algal blooms.
Total nitrogen (TN) is the sum total of nitrogen (ammonia, organic, and reduced nitrogen) and nitrate-nitrite. Possible sources of nitrogen in the lakes include: runoff from forest lands, fertilized lawns, failing septic systems, and runoff from animal manure/storage areas.
Nitrogen serves as a fertilizer for plants and can contribute to algal blooms.
Total phosphorus (TP) is a measure of all forms of phosphorus that are found within a sample. Phosphorus, like nitrogen, can be sourced from runoff from forest lands, lawns, sewage or animal manure that enters surface waters.
Phosphorus acts as a fertilizer for many plants and can also contribute to algal blooms.
In 2021, a series of water samples were collected across the six lakes. The number of locations, depths, and timing of samples collected varied across the lakes so our initial round of sampling gives an incomplete picture of how the lakes are faring.
Figure 1 shows that Big Sky Lake had the highest sampled concentration of total nitrogen and was the only lake to exceed Montana water quality standards for TN.
However, water quality varies with location on the lake, time of year of the sample, and depth, so this initial sample might not be representative of overall lake health.
The remaining lakes show similar concentrations of TN but lack sufficient numbers, locations and depths of samples to well characterize water quality.
Figure 2 shows that Big Sky Lake had the highest concentration of total phosphorus. State water quality standards for TP vary but Big Sky Lake is closest to exceeding state standards of 20 micrograms per liter of TP.
Again, a single sample is insufficient to characterize water quality in any lake but this gives us a snapshot of what may be going on beneath the surface.
To better understand what's going on at different depths and different times at the lakes, CRC will sample all six lakes this summer, using the same time frame.
For nutrient analysis, there will be two to five samples per lake during five separate sample collection events.
Along with nutrient analysis, CRC also monitors E. coli levels throughout the Clearwater Lakes as well as potential presence of various Aquatic Invasive Species (AIS).
The results shown here are a very brief summary of what we have learned, but CRC plans to share these data, and other MT water quality (WQ) Standard per DEQ Circular 7 and 12a collected data, with the community at a public forum later this summer.
For deeper analyses on both ongoing and past projects currently released, please consult our website at http://www.crcmt.org.


Reader Comments(0)